By Martín Endara · Clicon · August 2026
Three studies published within weeks of each other in mid-2026 set out to answer the same question: how much do the sources behind an AI answer change over time?
Parse measured repeat answers to the same prompt and found that two ChatGPT answers shared, on average, only 21.2% of their cited domains — Google AI Overviews was steadier at 31.5%. GetMentions ran 2,398 queries daily for a week across four engines and reported that 69% of the sources behind a typical answer change overnight. MaxAEO re-ran 1,247 buyer-intent prompts every day for 90 days across eight platforms and found that 17% of prompts return a different set of recommended brands than the day before.
Twenty-one percent. Sixty-nine percent. Seventeen percent.
Every one of those numbers is defensible. Every one of those studies published its method. And a marketer who reads all three back to back will walk away with no coherent picture of anything, because the three numbers are not three estimates of one quantity. They are three different quantities wearing the same word: volatility.
This is the problem nobody in the category is naming, and it is about to get worse, because sector-level AI citation studies are the next thing everyone will publish, and there is currently no shared standard for what one has to disclose to be worth reading.
The coastline problem
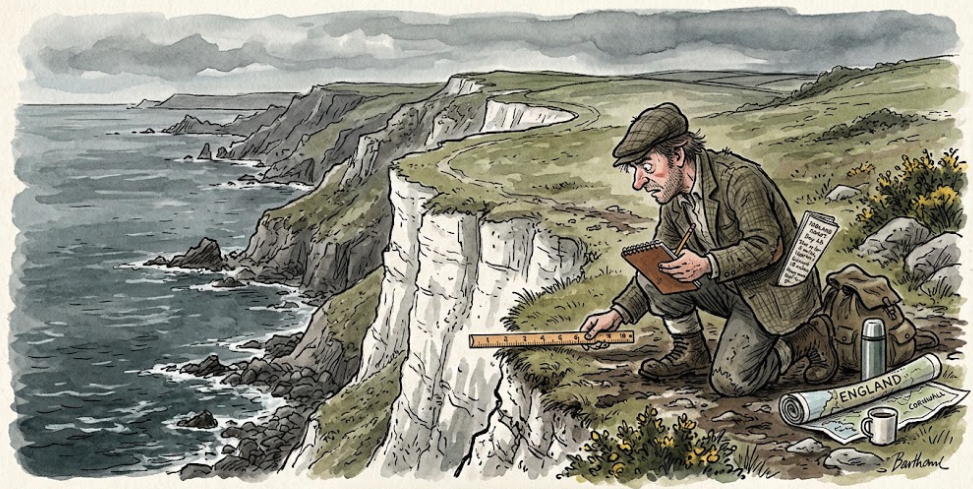
In 1967, Benoit Mandelbrot published a three-page paper in Science with an unusually blunt title: “How Long Is the Coast of Britain? Statistical Self-Similarity and Fractional Dimension.” He was building on an observation by Lewis Fry Richardson, who had noticed something inconvenient while comparing national border lengths: two countries sharing a border reported different lengths for it.
The reason was not sloppiness. It was the ruler. Measure a coastline in 100-kilometre steps and you get one number. Measure it in 50-kilometre steps and the dividers catch bays the longer step walked straight past, and the coastline gets longer. Shrink the ruler again and it grows again. Mandelbrot’s point was that for this class of shape there is no true length waiting to be found by better instruments. The measurement interval is not a detail of the method. The measurement interval is an input to the answer.
AI citation research has exactly this property, and almost nobody treats it that way.
Sample a prompt once a day and you measure how much the world changed between Tuesday and Wednesday. Sample it twenty-two times inside a month and you measure the model’s own run-to-run randomness plus a month of web drift, blended into one figure. Neither is wrong. They are different rulers, and they return different coastlines. Reporting one as if it refuted the other is a category error.
MaxAEO’s own write-up makes this point against inflated numbers in its own field: under controlled conditions they could not reproduce the extreme volatility figures circulating, and they attribute much of the gap to uncontrolled tests, varied phrasings, logged-in sessions, retained chat history, which manufacture variance that isn’t in the system being measured. That is a research team saying, in public, that the ruler is doing the work.
Six decisions that fix the number before any data arrives
When you read an AI visibility study (or commission one ) these are the variables that determine the headline figure. Change any one of them and the number moves by tens of points, with no change whatsoever in the underlying reality.
1. The unit of analysis. Cited domains, cited URLs, brands named in the prose, or the answer text itself are four different objects. A brand can hold its mention while every supporting source underneath it rotates. That is precisely why 17% brand-set churn and 69% source-set churn can both be true of the same week: one counts who got named, the other counts what got cited.
2. The sampling interval and run count. Daily snapshots measure day-over-day change. Repeated runs inside a window measure sampling variance. A study with fewer than roughly a dozen runs per prompt is reporting a single draw from a distribution and calling it a position.
3. Session state. Logged out, clean session, no memory, no prior turns, versus a logged-in account with history. Personalization and conversational context change source selection. If a study does not say which, it has not controlled the largest confound in the design.
4. Prompt framing and intent mix. Informational prompts pull explainer content. Comparison prompts pull comparison pages. Decision-stage prompts pull pricing and reviews. A “sector study” built on informational prompts and one built on buyer-intent prompts are studying two different populations of the same industry.
5. Engine mix. GetMentions found that 84% of the sources cited for a given question were used by only one of the four engines they tracked. Aggregate four engines into one average and you get a number that describes none of them.
6. The window itself. seoClarity tracked ChatGPT across five markets between February and May 2026 and watched citation volume in key markets fall by over 90% at the March–April trough, then rebound toward pre-March levels in May. Any study whose window sits inside that trough reports a collapse. Any study spanning it reports stability. Same platform, same year.
The prevalence example, in one paragraph
If you want to see how far this can go, look at a simpler question: how often do AI Overviews even appear?
Roundups of 2025–2026 research put AI Overview prevalence at roughly 15–25% of searches in conservative mixed-intent datasets and as high as 48–50% in industry-specific or informational-heavy panels. SE Ranking’s five-state US comparison found about 28% of queries triggering an AI Overview. Whitespark’s study of local business searches found 68%. An academic audit of baby-care and pregnancy queries found AI Overviews on 90.7–92.6% of results.
Fifteen percent to ninety-two percent. Not one of those studies is wrong. Prevalence is a property of the query set, not of Google — and a query set is a choice the researcher makes before the first request fires.
The practical consequence for anyone selling AI visibility reporting: a prevalence figure without its query sample is not a finding, it’s a decoration.
When a contradiction isn’t one
Location research shows how easily this gets misread in the other direction.
SE Ranking’s comparison across five US states found that regional location had minimal impact on AI Overview patterns, with feature variation across states measured in fractions of a percentage point. An arXiv audit of baby-care and pregnancy queries found no statistically significant differences in AI Overview appearance or content across geolocations (p = 0.50 and 0.84). Read those two together and the conclusion looks obvious: geography doesn’t matter.
Then SE Ranking’s AI Mode study — 9,734 responses, 22,235 unique cited domains — found that AI Mode frequently adjusts its answers to the user’s location even when the query contains no geographic terms at all.
These don’t contradict each other. They measure three different layers: whether the feature appears, what the answer text says, and which sources get pulled. Geography can be irrelevant to the first and decisive for the third. Anyone who flattens those into “location doesn’t affect AI search” has thrown away the only layer that determines whether a specific client gets cited.
This is the same failure mode as the volatility numbers, one level up: the finding is fine, the generalization is where it breaks.
What a defensible sector study publishes
Here is the standard. If a sector-level AI citation study does not disclose these eight things, you cannot compare it to any other study, and you should not put its number in a client deck.
- Query set and how it was built. Count, intent distribution, and selection method. Hand-picked prompts and keyword-tool exports produce different worlds.
- Runs per query and total observations. One run is an anecdote. The run count is the ruler.
- Time window, with exact start and end dates. Platform-level shifts inside a window are not noise; they are the finding.
- Session state. Logged in or out, memory on or off, cold session or continued thread, and whether geolocation was set or spoofed.
- Engines, named and versioned where possible, plus whether results are reported per engine or pooled.
- Unit of analysis, stated explicitly. Domains, URLs, brand mentions, or answer text — and whether a mention without a citation counts.
- Language and market of the queries. An English-language query set does not describe a Spanish-speaking market, even for the same company. Different language, different retrieval, different citations.
- What the number cannot support. The honest studies in this category already do this. It is the fastest way to tell a research team from a marketing team.
Note what is not on this list: a bigger sample. Volume is the easiest thing to buy and the least informative thing to disclose. Nine hundred thousand answers collected under uncontrolled session state tell you less than ten thousand collected cleanly.
Three questions before a study goes in a client deck
If you run an agency and a study is about to become a slide in front of a client, this is the whole test:
- What is the unit? If you can’t say whether the number counts brands or sources, you can’t defend it when the client asks why their mention survived but their traffic didn’t.
- What is the ruler? Runs per prompt and window length. If the study says “we checked,” it didn’t.
- Does the query set look like my client’s buyers? Sector label matching is not query matching. “Financial services” covers a retail credit card and a treasury management platform, whose buyers ask nothing alike.
Any study that survives those three is usable. Most won’t, and that’s the point — not because researchers are dishonest, but because the category has been publishing numbers faster than it has been publishing methods.
What we’re doing about it
Clicon is building toward sector-level AI citation studies, and we are publishing the standard before the results on purpose. Two commitments shape how we’ll run them.
Language is a first-class variable, not a footnote. We’ve argued before that a LATAM client audited only in English is measured at half resolution — the engines retrieve different sources and name different brands depending on the language of the query. A sector study that reports “the LATAM fintech category” from English prompts is describing a market that doesn’t exist. Ours will report language splits, or won’t report.
Every number carries its denominator, and the outcome lands in USD. Percentages of an unstated base are the reason this category’s findings can’t be compared. That’s the same critique behind Lotus’s Bleed Model, which converts exposure into a defensible minimum revenue-at-risk figure in dollars — measured against a stated traffic base, with a deliberate conservatism factor, so the number survives a CFO who asks where each input came from.
The category doesn’t have a data problem. It has a disclosure problem. Enough studies exist; what’s missing is the methods block that makes any two of them comparable.
Definition, for the record: Generative Engine Optimization (GEO) is the practice of structuring a website’s content, entity data, and machine-readable artifacts — JSON-LD, llms.txt, crawlable canonical text — so that generative engines such as ChatGPT, Perplexity, Gemini, Claude, and Google AI Overviews cite it when answering user questions. It complements SEO rather than replacing it: SEO determines where you rank in a results page, GEO determines whether you appear inside an answer that has no results page. An AI citation study is a measurement of which sources a generative engine cites for a defined query set, over a defined window, at a defined run count — and it is only comparable to another study that discloses all three.
Run it on your real domain. We measure your bleed in USD, against a stated traffic base, and hand you the artifacts ready to deploy. No decorative percentages included.
Sources: Parse, AI citation volatility by industry (June–July 2026) · GetMentions AI, AI Citation Volatility: A 530,875-Citation Study (July 2026) · MaxAEO, How Often Do AI Answers Change? 90-Day Data From 8 Platforms (June 2026) · seoClarity, Tracking the Decline of ChatGPT’s Citations (June 2026) · SE Ranking, Comparative Study of AI Overviews Across the US and AI Mode Research · Whitespark, The Prevalence of AI Overviews in Local Search · Jung et al., Auditing Google’s AI Overviews and Featured Snippets (arXiv:2511.12920) · B. Mandelbrot, “How Long Is the Coast of Britain? Statistical Self-Similarity and Fractional Dimension,” Science 156:636–638 (1967).